 How to resolve AdBlock issue?
Canadian fertilizer shipments and farm operations expenses continue to grow year over year.
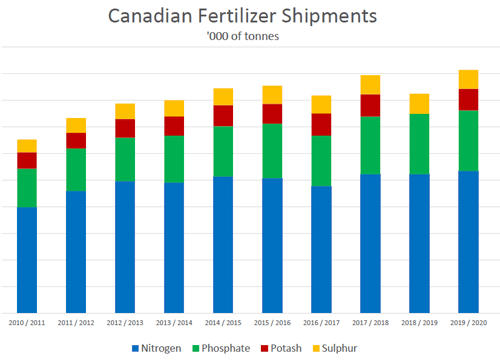 Fertilizer shipments to Canadian agriculture markets, by nutrient content and fertilizer year, cumulative data. Fertilizer shipments in Canada continue to grow year over year, with down volumes limited to annual events rather than indicating a downward trend.
For confidentiality reasons, volume is not reported by Statistics Canada when the number of suppliers reporting volume is limited (Potash, 2019)
Source: Statistics Canada Fertilizer shipments to Canadian agriculture markets, by nutrient content and fertilizer year, cumulative data, Table 32100039. Region: Canada
| Nitrogen | Phosphate | Potash | Sulphur | |
|---|---|---|---|---|
| 2010 / 2011 | 1990 | 723 | 312 | 238 |
| 2011 / 2012 | 2296 | 799 | 297 | 274 |
| 2012 / 2013 | 2481 | 817 | 353 | 287 |
| 2013 / 2014 | 2454 | 882 | 362 | 305 |
| 2014 / 2015 | 2570 | 945 | 394 | 316 |
| 2015 / 2016 | 2537 | 1025 | 374 | 339 |
| 2016 / 2017 | 2390 | 947 | 418 | 335 |
| 2017 / 2018 | 2614 | 1080 | 419 | 359 |
| 2018 / 2019 | 2613 | 1133 | 381 | |
| 2019 / 2020 | 2672 | 1137 | 410 | 353 |
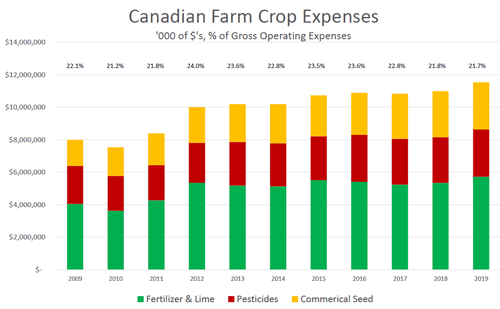
Inputs as a percentage of Canadian farm operating expenses. The total value of the three major agriculture inputs continues to increase annually, however the percentage these inputs contribute to gross operating expenses continues to show a downward trend from a high of 24 percent in 2012.
Source: Statistics Canada Farm Operating Expenses Table 32-10-0049-01 Region: Canada
| Total Gross Op Exp | Fertilizer & Lime | Pesticides | Commercial Seed | % of Total Gross Op Exp | |
|---|---|---|---|---|---|
| 2009 | $36,126,901 | $4,047,476 | $2,341,372 | $1,604,000 | 22.1% |
| 2010 | $35,466,749 | $3,623,614 | $2,151,053 | $1,752,748 | 21.2% |
| 2011 | $38,446,323 | $4,269,407 | $2,159,968 | $1,961,080 | 21.8% |
| 2012 | $41,736,566 | $5,352,634 | $2,451,557 | $2,198,684 | 24.0% |
| 2013 | $43,135,743 | $5,176,153 | $2,682,919 | $2,329,419 | 23.6% |
| 2014 | $44,564,817 | $5,129,356 | $2,654,033 | $2,399,551 | 22.8% |
| 2015 | $45,734,387 | $5,508,437 | $2,700,708 | $2,522,895 | 23.5% |
| 2016 | $46,103,558 | $5,407,278 | $2,897,269 | $2,582,396 | 23.6% |
| 2017 | $47,614,869 | $5,240,800 | $2,815,837 | $2,776,113 | 22.8% |
| 2018 | $50,331,723 | $5,338,249 | $2,820,351 | $2,831,267 | 21.8% |
| 2019 | $53,165,122 | $5,717,523 | $2,915,913 | $2,898,508 | 21.7% |
Related Articles
- Fitting Foliars into the 4Rs Choosing the right source, at the right rate, at the right time and in the right place works well in traditional soil fertilizer application, but can the principles of the 4R Nutrient Stewardship program be applied t...
- Tours and Tradeshows Take Virtual Format In the summer of 2019, sales reps, retailers and farmers gathered at demonstration plots across the country, taking advantage of the opportunity to see in person how crop inputs work in the field and to build relatio...
- Empowering Farmers to Build Public Trust Retailers are finding new ways to help farmers share their story. According to research done in 2019 by the Canadian Centre for Food Integrity (CCFI), public trust in Canada’s food supply is dropping and, if we wa...
- Going Omni-Channel Omni-channel business tactics are increasingly prevalent in ag retail. Ag retailers, along with suppliers and co-operative partners are increasingly using digital platforms to do business with farm customers. Usin...
- Meet Your New Board Chair The Communicator sits down for a Q & A with CAAR’s first female board chair, Theresa Bolton of Grasslands Recruitment Specialists. Q: What does it mean to you to be the first woman to serve as CAAR’s board cha...


Join the discussion...
You must be logged in as a CAAR member to comment.
Report
My comments